
Shutterstock.com
Key points
- A broad range of clinical evidence exists, but understanding the quality and the relevance of those data can be complicated.
- Understanding study design, as well as the statistics and common terms used in the literature will make this vital source of information more accessible.
- Pharmacy professionals must be able to extropolate this information from the evidence base and correctly apply it to patients.
Clinical data inform guidelines and practice, and are the foundation upon which evidence-based medicine rests. However, not all data are equivalent or of equal quality. Consequently, pharmacists and pharmacy teams must develop strategies to assess the quality of evidence for health claims, effectiveness and applicability.
This article will examine the sources of evidence; the variety of evidence types and study designs; and how results are tÂypically reported. It also looks at the precautions pharmacists and pharmacy teams should take when interpreting results as part of the clinical decision-making process, and the questions you should ask yourself when applying evidence-based practice to your patient (see Box), because these decisions can ultimately affect patients. For information on clinical guidelines and the evidence-base to support the management of acute pain, see ‘
Clinical guidelines and evidence base for acute pain management’.
Types of analytic study design
Experimental
The objective of clinical studies is to establish the effect of an intervention (e.g. drugs, devices and/or health education). This is achieved by controlling for bias and minimising variation. Randomised controlled trials (RCTs) are considered to be the ‘gold standard’ for the evaluation of proposed interventions (e.g. a new drug treatment). Studies of this type minimise selection bias through randomising the allocation of the intervention and a control (e.g. placebo or standard drug treatment) to participants[1]
. In randomised crossover studies, interpatient variability — which may affect outcomes of the study — may be precluded from influencing the findings by allowing participants to serve as their own control. This involves exposing the control participants allocated to the treatment and vice versa at different, predetermined stages of the study, then comparing outcome measures accordingly[2]
. Unlike open-label trials, blinding both participants and researchers (‘double blind’) to the intervention type further reduces bias during outcome reporting and interpretation.
Observational analytic
Where allocation of a suitable control may not be possible in some situations (owing to practical or ethical reasons), observational studies — which generally do not involve direct intervention by the researchers — may be carried out. More specifically, a cohort study involves the observation of a group of subjects from the population and tracking outcomes at specified intervals over a given period of time (longitudinal). Alternatively, a cross-sectional study includes subgroups that are representative of the subpopulations that exist in a population of interest and provides a snapshot of outcomes. In the absence of a control group, subjects who are exposed to a treatment may still be compared with other subjects who are matched for one or more relevant variables (e.g. age, health status, socioeconomic background) but are not exposed to the treatment. These are considered to be case-controlled studies.
Systematic review
When a sufficient number of studies have been carried out, the findings can be synthesised in a systematic review, which may involve statistical analysis (also known as meta-analysis). In some instances, different interventions, which have not been directly studied in the same trial but share a common comparator in other studies, may still be compared indirectly in a network meta-analysis (see Figure 1)[3]
.
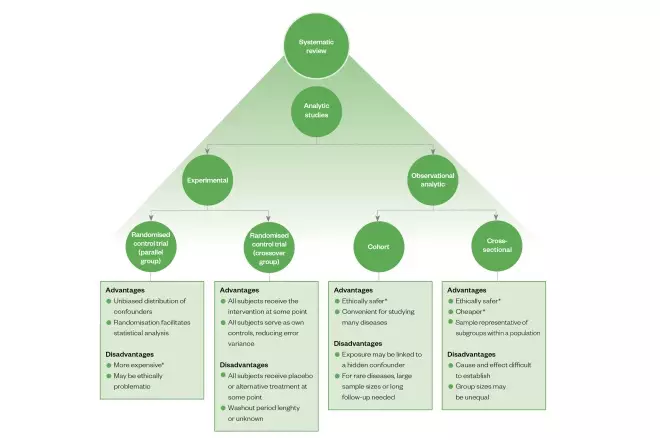
Figure 1: Overview of the main types of analytic study design, including some of their advantages and disadvantages
*Relative to the other options
Sources of evidence
When looking to answer a clinical question, there are many places to find evidence. The Cochrane Database of Systematic Reviews
[4]
is an excellent starting point because, among other things, each systematic review is independently compiled by at least two people[5]
. Included studies are also assessed for quality as well as bias. Evidence summaries available from the Joanna Briggs Institute, an international not-for-profit, research and development centre within the Faculty of Health and Medical Sciences at the University of Adelaide, are also a useful resource as these provide overviews of synthesised evidence presented in systematic reviews[6]
. Additionally, evidence from individual studies can be obtained from medical databases including PubMed[7]
, EMBASE[8]
, CINAHL[9]
and the National Institute for Health and Care Excellence[10]
, which will include clinical studies from prominent medical journals such as The New England Journal of Medicine
[11]
, The Lancet
[12]
, The British Medical Journal
[13]
and the Journal of the American Medical Association
[14]
.
Interpreting clinical study data
Once the relevant sources of data have been located, it is important to look more closely at the findings. The questions typically asked of evidence categorically fit into either or both of the following:
- Is treatment or intervention X effective?
And/or
- What are the risks associated with the treatment or intervention?
However, the answer is often entangled in a string of numbers and statistics; numbers needed to treat (NNT); odds ratio (OR); hazard ratio (HR); relative risk (RR); absolute risk; confidence intervals (CIs); and P- values. These common terms are best described using a worked example — below is an extract from the Systolic Blood Pressure Intervention Trial (SPRINT)[15]
, a randomised, controlled, open-label trial that examined the benefits and risks of prescribing intensive treatment (intervention) versus standard treatment (control) to lower the blood pressure of patients with hypertension.
“… a significantly lower rate of the primary composite outcome in the intensive-treatment group than in the standard-treatment group (1.65% per year vs. 2.19% per year; HR with intensive treatment, 0.75; 95% CI, 0.64–0.89; P<0.001)… Trial participants assigned to the lower systolic blood-pressure target (intensive-treatment group), as compared with those assigned to the higher target (standard-treatment group), had a 25% lower relative risk of the primary outcome… the NNT with a strategy of intensive blood pressure control to prevent one primary outcome event was 61.”
[15]
Plainly said, the average annual proportion of patients who suffered a primary composite outcome (i.e. myocardial infarction, other acute coronary syndromes, stroke, heart failure, or death from cardiovascular causes) was lower in the intensive treatment group (1.65%) compared with the control group who received the standard treatment (2.19%).
The HR is the ratio of the chance of an event occurring in the intervention group compared with the control group. In this example, the chance of the primary composite outcome occurring in the intensive treatment group is 75% of (i.e. lower than) the control group, so the ratio is 0.75.
As clinical studies generally involve only a sample of participants from a population (rather than the whole population), CIs are provided to estimate the range in which a statistic for the whole population might be found at a specified probability. Here, it could be said that there is a 95% probability that the true HR for patients from the whole population who are receiving intensive treatment (compared with standard treatment) will be between 0.64 and 0.89 (95% CI, 0.64–0.89), and the probability (P -value) of the 0.75 HR being erroneous is less than 0.001 (i.e. P <0.001).
The RR describes the ratio of probabilities of an event occurring in a group exposed to treatment compared with that in the control group[16]
. In this example, the RR of the primary outcome of the intensive-treatment group as compared with the standard-treatment group is 0.75 (1.65%/2.19% = 0.75; i.e. 25% lower).
NNT refers to the number of patients who need to receive the intervention for one patient to incur the intended outcome of the treatment. In this example, a value of 61 for the NNT (after a median of 3.26 years) can be interpreted in the following way: 1 in every 61 patients receive additional protection to prevent one primary outcome by getting the intensive treatment compared with standard treatments. It is calculated by taking the inverse of the absolute risk reduction, which is the difference in rates of the outcome in the treatment group and that of the control group.
Precautions to take
In order to implement evidence-based practice, there are some questions you need to ask yourself about the clinical data and how to apply it to your patient (see Box).
Box: Key questions to ask when assessing clinical data
- What are the study’s limitations?
- Looking at the level of blinding (e.g. open label, single blind, double blind), the number of participants in the study and the confidence interval (i.e. a wide confidence interval indicates uncertainty in the results) will help here;
- There is also a risk of bias if the trial was cut short or a lot of patients were lost to follow-up.
- Does this apply to my patient?
- Looking at the exclusion criteria for the trial will help here.
- Is my patient sufficiently similar to the patients in the studies examined?
- Looking at the variance of the treatment effects will help here; the larger the variance, the less likely the treatment will be for an individual.
- Does the treatment have a clinically relevant benefit that outweighs the harms?
- Looking at the statistical significance will help here.
- Is another treatment better?
- Looking at how the benefit and harm profiles compare will help here.
- Is this treatment feasible in my setting?
- Looking at how the interventions were administered will help here.
- Is there publication bias?
- Looking at trial registers and conflicts of interest could help here.
It is not always possible to avoid bias; therefore, it is important to consider potential sources of it when interpreting clinical data. This typically includes inappropriate (or lack of) randomisation of treatment allocation, blinding and treatment of incomplete data[5]
. It also important to consider the validity of the data; whether claims are accurately represented. For example, it would be misleading to report and compare incidences of a certain event (such as heart attacks) by absolute numbers rather than that per capita between two comparable communities, because the former does not account for population size, which is likely to influence the findings.
In any study, it is also important to note possible confounding variables. In the SPRINT example above, the researchers excluded patients who had diabetes mellitus or prior stroke because they have a known comorbidity and risk factor, respectively, that would affect the primary outcome of the study. However, by doing this, findings and conclusions are reflective of patients with hypertension in the population and should not be extrapolated to include patients with diabetes mellitus or prior stroke. Other relevant variables that could impact the outcomes of the study (e.g. age, cholesterol levels and body mass index) were adjusted for during analysis.
Outcomes reported in studies where a conflict of interest may exist, such as that arising from research funded by drug companies, should be scrutinised further as outcomes have been shown to be more likely in favour of the sponsor[17]
. Collectively, it is also prudent to consider the effect of “publication bias” that typically arises when positive trials are published, while negative trials are likely to remain unpublished, leading to conclusions based on the appraisal of incomplete evidence (see Box). Hence, examining entries and evidence in trial registers (e.g. the WHO International Clinical Trials Registry Platform[18]
, UK Clinical Trials Gateway[19]
, ISRCTN Registry[20]
, ClinicalTrials.gov[21]
, Australian New Zealand Clinical Trials Registry[22]
), is considered good practice. Furthermore, as primary outcomes are included in submissions to the trials registry, prior to the commencement of the trial, it enables easy identification of selective reporting[23]
. Additionally, reporting guidelines may also be consulted to assess completeness and transparency[24]
.
Conclusion
It is a privilege to have a variety of quality sources of evidence (i.e. systematic review databases, medical databases, medical journals and trials registries) that can be accessed and inform clinical decision-making. However, as trials are typically conducted on a sample, rather than the whole population it is important to consider how accurately and the extent to which the findings are representative of the population. Therefore, results (e.g. HR and RR) are typically statistical probabilities, where a high level of confidence (e.g. 95% or 99%) with a reasonably narrow CI or significance indicated by a small P -value (e.g. P <0.05) are more likely to be reflective of outcomes that can be expected in the population given the same intervention.
Furthermore, it is prudent to consider risk of bias, data validity, confounding variables, conflicts of interest, publication bias and selective reporting. These factors are generally best addressed by examining evidence from a variety of sources prior to drawing conclusions and making recommendations for patients.
What do I do next?
The next article in our campaign will explain how you talk to patients about their acute pain management, by using the skills you have gained from understanding the range of guidelines and evidence available.
Safety, mechanism of action and efficacy of over-the-counter pain relief
These video summaries aim to help pharmacists and pharmacy teams make evidence-based product recommendations when consulting with patients about OTC pain relief:
- Safety of over-the-counter pain relief
- Mechanism of action of over-the-counter pain relief
- Efficacy of over-the-counter pain relief
Promotional content from Reckitt
References
[1] Cox DR. Randomization for concealment. JLL Bulletin: Commentaries on the history of treatment evaluation. 2009. Available at: http://www.jameslindlibrary.org/articles/randomization-for-concealment/ (accessed July 2019)
[2] Sills GJ & Brodie MJ. Antiepileptic drugs: Clinical drug development in epilepsy. In: Schwartzkroin PA, editor. Encyclopedia of Basic Epilepsy Research. Oxford: Academic Press; 2009;1477–1485. doi: 10.1016/B978-012373961-2.00033-3
[3] Li T, Puhan MA, Vedula SS et al.; The Ad Hoc Network Meta-analysis Methods Meeting Working Group. Network meta-analysis-highly attractive but more methodological research is needed. BMC Med 2011;9(1):79. doi: 10.1186/1741-7015-9-79
[4] Cochrane Library. Available at: https://www.cochranelibrary.com (accessed July 2019)
[5] Higgins J & Green S (Eds). Cochrane Handbook for Systematic Reviews of Interventions. The importance of a team. 2011. Available at: http://handbook-5-1.cochrane.org (accessed July 2019)
[6] The Joanna Briggs Institute. JBI Clinical Online Network of Evidence for Care and Therapeutics (COnNECT+). Available at: http://connect.jbiconnectplus.org/ (accessed July 2019)
[7] PubMed. US National Library of Medicine. Available at: https://www.ncbi.nlm.nih.gov/pubmed/ (accessed July 2019)
[8] Embase. Elsevier. Available at: https://www.elsevier.com/solutions/embase-biomedical-research#search (accessed July 2019)
[9] CINAHL Database. EBSCO Industries. Available at: https://health.ebsco.com/products/the-cinahl-database (accessed July 2019)
[10] National Institute for Health and Care Excellence. Available at: https://www.evidence.nhs.uk/ (accessed July 2019)
[11] The New England Journal of Medicine. Available at: https://www.nejm.org/ (accessed July 2019)
[12] The Lancet. Elsevier Inc. Available at: https://www.thelancet.com/ (accessed July 2019)
[13] The British Medical Journal. BMJ Publishing Group Ltd. Available at: https://www.bmj.com/ (accessed July 2019)
[14] JAMA Network. Available at: https://jamanetwork.com/journals/jama/ (accessed July 2019)
[15] Wright JT Jr, Williamson JD, Whelton PK et al.; SPRINT research group. A randomized trial of intensive versus standard blood-pressure control. N Engl J Med 2015;373(22):2103–2116. doi: 10.1056/NEJMoa1511939
[16] Tenny S & Hoffman MR. Relative Risk. In: StatPearls. Treasure Island (FL): StatPearls Publishing. 2019. PMID: 28613574
[17] Lexchin J, Bero LA, Djulbegovic B & Clark O. Pharmaceutical industry sponsorship and research outcome and quality: systematic review. BMJ 2003;326(7400):1167. doi: 10.1136/bmj.326.7400.1167
[18] World Health Organization. International Clinical Trials Registry Platform (ICTRP). Available at: https://www.who.int/ictrp/network/primary/en/ (accessed July 2019)
[19] UK Clinical Trials Gateway. Available at: https://www.ukctg.nihr.ac.uk/home/ (accesssed April 2019)
[20] ISRCTN Registry. BioMed Central Ltd. Available from: https://www.isrctn.com/ (accessed April 2019)
[21] ClinicalTrials.gov. NIH, US National Library of Medicine. Available at: https://clinicaltrials.gov/ (accessed July 2019)
[22] Australian New Zealand Clinical Trials Registry. Available at: http://www.anzctr.org.au/ (accessed July 2019)
[23] Eysenbach G. Tackling publication bias and selective reporting in health informatics research: register your ehealth trials in the international ehealth studies registry. J Med Internet Res 2004;6(3):e35. doi: 10.2196/jmir.6.3.e35
[24] EQUATOR Network. UK EQUATOR Centre. Available at: http://www.equator-network.org/ (accessed July 2019)
You might also be interested in…
The importance of diverse clinical imagery within health education

Government should consider ways to prevent ‘inappropriate overseas prescribing’ of hormone drugs, review recommends