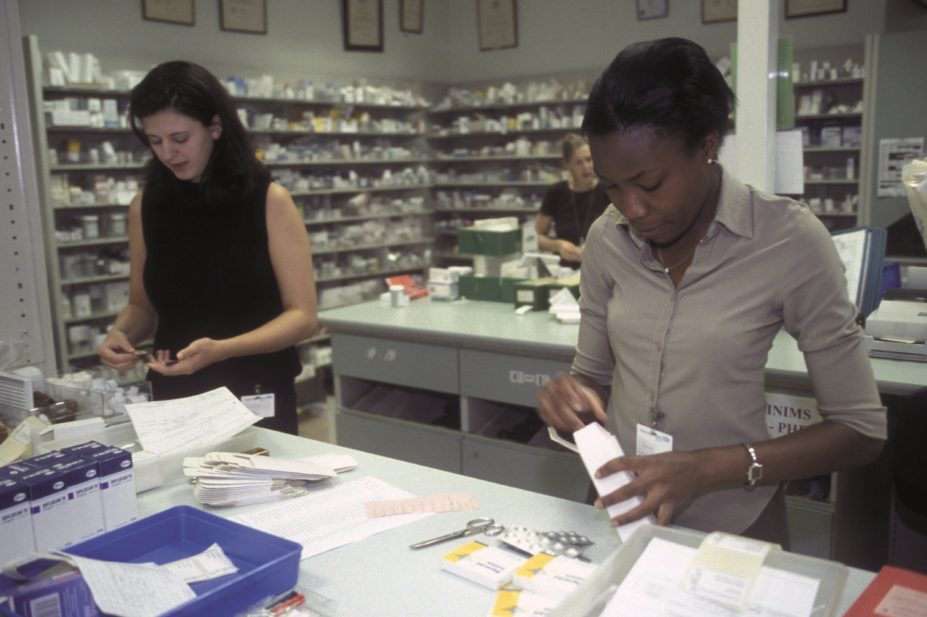
Photofusion / Rex Features
Imagine you are a chief pharmacist at a large teaching hospital that delivers many services above and beyond those traditionally delivered by, for example, a small district general.
Perhaps you have a few members of staff involved with clinical governance who ensure that, when medical errors occur, any learning points are identified and disseminated to other staff. Perhaps one of your staff co-ordinates and delivers an extensive training programme to nurses and medical staff. Perhaps you offer numerous work experience placements to students and require someone from your team to co-ordinate them. Perhaps your local clinical commissioning group demands more scrutiny of your medicines use than in other areas.
Now suppose that an exercise, designed to benchmark the pharmacy-related productivity of all NHS trusts in England and Wales, does not ask about these activities. All of a sudden, you have a wage bill that is larger than the trust down the road and a case to answer to your finance director.
It is likely to be concerns such as this that have led to a delay in one of two pharmacy projects currently being co-ordinated by the NHS Benchmarking Network, a not-for-profit organisation that conducts audits at the request of its members. The delayed project focuses on provider services (mainly hospitals and mental health trusts) and the other one focuses on commissioners (for example, clinical commissioning groups).
“Most senior pharmacists who are aware of this [provider] audit are not looking forward to the direct comparison with smaller organisations which rank more favourably in terms of departmental or organisational performance,” says Jon Beard, chief pharmacist at Musgrove Park Hospital.
The NHS Benchmarking Network’s raison d’être is to work “with its members to understand the wide variation in demand, capacity and outcomes evident within the NHS and define what good looks like”. Its members currently include around 70% of English NHS bodies (from primary and secondary care), all of the Welsh health boards, the Department of Health, NHS England, health sector regulator Monitor and support organisation NHS Wales Shared Services Partnership.
The concept was simple. Draft questionnaires (one for providers, one for commissioners) would be constructed following scoping exercises attended by a large group of chief pharmacists. The drafts would be circulated to the chief pharmacists for comment (the consultation period lasting a few weeks). With comments taken on board, the questionnaires would be finalised and sent to trusts for completion. Finally, data collection would be done online and, a couple of months later, the NHS Benchmarking Network would have analysed and released the results.
However, it appears the process was not quite so straightforward. Although the final commissioners’ questionnaire was released in mid-September 2014, the one for providers has been delayed by the NHS Benchmarking Network for at least a couple of months following a higher-than-expected amount of feedback during the consultation period.
A spokesperson for the NHS Benchmarking Network says more than 600 specific comments on the draft questionnaire for provider services have been received. The aim now is for the final version to be released in November 2014 with the results being published in the spring of 2015. By comparison, the results of the commissioner project should be ready early in 2015.
The concerns
“I think the concerns about staffing are very real,” says Damian Child, chief pharmacist for Sheffield Teaching Hospitals NHS Foundation Trust, who attended the scoping exercise. “I believe the NHS Benchmarking Network has a genuine interest in raising standards of practice. However, there is also a risk that the data could be misused by desperate trusts attempting to hammer staffing levels down to the lowest common denominator in a misguided attempt to save money.”
“There is also a risk that the data could be misused by desperate trusts attempting to hammer staffing levels down to the lowest common denominator in a misguided attempt to save money.”
Child says he knows that, from comments made by other hospital chiefs, most are open to the potential benefits of benchmarking as a tool to help drive up standards — and are committed to doing so — but there are also a lot of concerns.
The first draft of the provider questionnaire contained such a large number of questions that the workload involved in completing it would be extensive, says Child (see Panel). He also believes that some questions could be open to significant subjective interpretation. For example, one question is “does pharmacy support the critical care unit?” At Sheffield, where Child works, there are three critical care units and each receives differing levels of support. In addition, some questions request data that are already collected in a different format (for example, information on staffing levels is already submitted to the annual national pharmacy workforce review).
Other criticisms are that the data required to answer some of the questions are not readily available in many hospitals, some questions ask for a simple ‘yes or no’ when the reality may be more complex, and the relevance of some data being requested is questionable (for example, drug cost by British National Formulary category).
Another section asks trusts to confirm whether they have fully, partly or not implemented each of the Royal Pharmaceutical Society’s (RPS) hospital pharmacy standards. This adds a further 122 data fields to the questionnaire — some of which might be difficult to measure (for example, patients and their carers are treated with compassion, dignity and respect by pharmacy staff).
Catherine Duggan, the RPS’s director of professional development and support, says that the RPS recognises that each hospital may have its own mechanisms for assessing patient satisfaction with their services, and acknowledges that it is for each hospital to assess implementation of these particular standards. She adds that the RPS plans to start a workstream to inform guidance for this standard and will be looking for examples of best practice.
The benefits
Despite these concerns, pharmacists can also see the benefits of collecting these data. Once the results are released, NHS trusts will be able to compare their own performance against others.
“Knowing which activities are undertaken by different departments will be useful in a number of ways,” says Beard, who also took part in the scoping exercise. “Assuming that an activity has a proven benefit to patients, those trusts not undertaking the activity could use the data to support business cases to implement it. Such activities should continue and, if there are trusts conducting them very efficiently, we should be seeking to learn how they do so.”
On the other hand, he says, if there are activities being undertaken for which there is no evidence of benefit, or there are other ways to achieve the same outcome, trusts may consider stopping these activities or changing processes to improve either the efficiency or quality of service.
“Ultimately, it will provide a direct comparison between trusts that can combat the historic argument from some trusts that ‘we’re different here’,” says Beard. The key will be to collect data on evidence-based activities and to ensure that outcome data (for example, the percentage of patients whose discharge medicines are ready for the intended time of discharge) are collected, rather than process data (for example, average time to dispense discharge prescriptions), he adds.
Child agrees on the importance of asking the right questions: “If we consider medicines reconciliation as an example, trusts are largely in agreement that we should see 80% of patients within 24 hours of admission. However, I don’t imagine that every trust is measuring that statistic in the same way and we need to understand the differences before we start making comparisons.”
Benefits are also foreseen in primary care. Jo Watson, head of medicines optimisation for south and west Devon, believes the project will further raise understanding and awareness of optimising medicines use. “It will not only focus on what is prescribed and at what cost, but also areas of safety and quality,” she says, adding that it will enable comparison of medicines use alongside hospital activity. “This will help promote discussion and further understanding on how medicines use can impact on both planned and urgent hospital care.”
Get involved
Some trusts may wonder whether the extensive workload of completing the questionnaire is worthwhile. Beard is clear: “Trust pharmacy departments should take part as this is an opportunity to improve the quality and efficiency of their service.”
Equally, Watson hopes that all organisations will engage with the process. “It will facilitate comparison of how medicines are used, governed and managed to support improvement of patient care,” he says. “This can only happen if every trust commits to completing the questionnaire.”
Draft questionnaire for providers
The size of the original draft is considerable — containing requests for over 500 lines of data. It has been divided into several subsections. These include:
- Baseline information (patient numbers and number of beds)
- Pharmacy structure (number of dispensaries)
- Policies and procedures (percentage formulary compliance, do you have a medicines governance group?)
- Hours of availability
- Equipment and capital (value of assets, equipment maintenance budget)
- Stock control and costing (total stock value, is patient-level costing in place?)
- Information and technology (do you have a prescription tracking system?)
- Activity and finance (costs by speciality and British National Formulary category)
- Clinical pharmacy (percentage of pharmacist time involved in clinical pharmacy, number of pharmacists involved in ward rounds)
- Homecare (number of patients supported by homecare, costs, method of reporting)
- Pharmacy finance (bank staff pay costs, medicines costs growth)
- Performance systems (average discharge prescription turnaround time, do you provide a pharmacy performance dashboard report?)
- Outsourcing
- Safety and quality (number of delayed or missed doses, number of never events, number of non-medical prescribers)
- Audit and accreditation (how many clinical audits was pharmacy involved with in 2013/2014?)
- Research and clinical trials (how many staff work on clinical trials, how many trials were worked on during 2013/2014?)
- Complaints and incidents (how many complaints and compliments the service received during 2013/2014?)