Abstract
Aim
To produce empirical evidence on the commitment to study pharmacy in terms of what motivates and influences students in their choice of subject and university.
Design
Self-completion survey. Quantitative analysis by SPSS.
Subjects and setting
Year 1 and year 4 undergraduates in schools of pharmacy in Great Britain.
Results
The response rate was 35.2%. Students registered a high desire to study pharmacy; 73% of year 1 and 71% of year 4 placed it first priority at the time of application. Of those for whom it was not first choice, medicine was the preferred option. The two most important factors in choice were reputation of the school of pharmacy and reputation of the university.
Conclusion
This study confirms that most applicants to study pharmacy were strongly committed to the subject. In addition, this study has allowed us to put an empirical figure to the proportion of students who at the time of applying for pharmacy would rather study medicine.
It is useful at this time of change in educational provision for the pharmacy profession to gain insight into how potential applicants choose to study pharmacy in the UK, so that information on careers in pharmacy may be targeted to suitable potential applicants and to help schools to market their courses to a wider audience.
The context of pharmacy education in the UK is one of substantial change. The number of universities offering the MPharm degree has dramatically increased over the past few years. From a static 16, the launch of many new schools of pharmacy since 2002 has increased the number of universities offering undergraduate pharmacy education to 24 and this number could rise. The consequence of an increase in the number of educational providers has and will continue to increase the number of students graduating from undergraduate pharmacy courses needing preregistration training places.
This is a significant feature because students will not qualify to practise unless they have completed their preregistration training year and passed the registration examination. An increase in the demand for preregistration places caused by increased numbers of MPharm graduates is coupled with an increase in the number of places for non-EU qualified pharmacist students on one-year diploma courses in the UK (known as the Overseas Pharmacists Assessment Programme or OSPAP course), where students study for one year at university before entering the preregistration year.
The number of OSPAP providers has increased over the past few years from a single institution to four schools of pharmacy. As graduates of these courses are also entering the increasingly competitive market for preregistration places there is concern that a corresponding growth in the number of preregistration positions available is unlikely.1
Currently, to be accepted on an undergraduate MPharm degree course, students need high examination grades in mainly science subjects, with some schools of pharmacy requiring two A grades and a B at “A”-level. However, it has been suggested that the current increases in the number of educational providers, without a parallel increase in the numbers of suitably qualified applicants, will result in many pharmacy schools being forced to admit students with lower examination grades in future.
Data from UCAS between 1998 and 2003 showed little change, from 3,185 applicants in 1998 to 3,140 in 2003, but the numbers of students accepted over that period rose from 1,826 (57 per cent) in 1998 to 2,376 (76 per cent) in 2003. Thus there has been an increase in the intake of students and a higher acceptance rate (data were obtained through the UCAS statistical service).2
What do we know already?
A scoping review of the published literature showed that the reasons and motivations for students to choose to study pharmacy have not been widely explored.3–6 Booth et al and Rees were possibly the earliest English published studies of factors influencing the choice of pharmacy as a career.3,4 Almost 20 years later Silverthorne et al5 asked the same questions about motivational influences on pharmacy undergraduates. However, these studies are limited in scope and small scale. For instance, Booth surveyed 164 applicants to his school, Rees surveyed 80 undergraduates in her school and Silverthorne et al surveyed two cohorts of year 3 students (n=184).
By comparison, little is known about what influences the choice of school of pharmacy. From overseas we identified the important work undertaken in the US, Australia and Canada. This was international cross comparator research by Ferguson et al, which explored the salient issues influencing 315 pharmacy applicants to Minneapolis, Melbourne and Toronto universities.6 The study showed that context is an important variable influencing choice of subject and place of study. The study noted that half of those not selecting pharmacy as a first choice had wanted to study medicine. This phenomenon was observed in earlier studies cited by Ferguson et al.
This paper is based on one section of a large baseline study of first- and final-year pharmacy undergraduates in Great Britain. It covers how committed students were to the course, whether it was their first choice of career, what the access route into their school of pharmacy was and which features of the school they attend attracted them. Section 2 in the survey, titled “Choice of school of pharmacy”, consisted of seven closed questions and was completed by all respondents.
Method
A comprehensive comparative survey of year 1 and year 4 pharmacy undergraduates was undertaken during 2005.
Design
A core set of questions was completed by both years, with a supplementary section for the year 4 students to comment on their in-school experiences. In five sections we covered: motivations and influences; choice of school of pharmacy; career image; future career ambitions; and work-life balance. The supplement asked about experience as a final-year student, together with standard personal details. The categories to define ethnicity were from the standard UK Census list.
The questionnaire contained 28 questions for year 1 and 40 for year 4, including both closed and open questions. A variety of question formats were used and four-option Likert scales to measure “important” or “not important”, and “strong” or “not strong” when we wanted to obtain a positive or negative response. Interested readers are referred to the final report.2
The survey questionnaire was designed after screening the limited amount of pharmacy literature we could obtain, as shown earlier, together with two work satisfaction surveys.7,8 We carried out exploratory focus-group work with 44 undergraduates, representing nine schools.
The participants were attending the British Pharmaceutical Students’ Association (BPSA) annual conference and volunteered to participate in the focused discussions. Four groups were convened, facilitated by three authors of this paper, taped and transcribed. The data from the focus groups gave us insights into the perceptions of students about their pharmacy experience, although we acknowledge that this was a group of highly motivated and engaged students, not necessarily representative of any particular opinion.
After initial design the questionnaire was peer-reviewed by pharmacy practice colleagues and piloted with two groups of pharmacy undergraduates: all year 1 students and all final year students in a UK school of pharmacy. All students involved in the design were included in the final sample.
Scope and administration
At the time of the survey 16 schools of pharmacy offered a full four-year undergraduate programme. Each school was invited to participate in the study. Two schools declined to participate, although we had promised anonymity and that no details of individual schools would be published. The sum of £500 was paid to each school to administer the survey and a raffle prize of £80 per participating school was offered to encourage students to respond.
Contact was made with each of the 16 established schools in England, Scotland, Wales and Northern Ireland. One English school and one school from Northern Ireland declined, thus the survey covered Great Britain and not the UK. Through negotiation with each contact it became clear that it would not be possible to carry out the same distribution method in every school.
In the face of a disappointing response we took the pragmatic decision to go with what was offered. Nine schools provided class lists, we sent named envelopes. Two schools would not provide lists, but numbers, so we sent numbered envelopes. Three schools distributed unmarked questionnaires during lecture time. All schools had to collect and return completed questionnaires to us. Owing to the distribution method employed, one school returned only 2.5 per cent of questionnaires and it was decided to eliminate this school from the study.
Schools determined the manner in which the survey was distributed. Therefore the ad hoc distribution method employed produced a highly variable response rate, which we discuss later. The final response rate (calculated using the total number of students in each of the two years) was 35.2 per cent (n=1,163/3,306), a rate varying between schools from 83 per cent at the highest (n=224/270) to 14 per cent at the lowest (n=36/256).
Ethical approval
The Aston University ethics committee gave ethical approval; two other schools needed ethical approval from their own institutions (granted in both cases).
Analysis
The data from 13 schools were analysed following coding and entry into the Statistical Package for Social Sciences Version 12 (SPSS). Valid responses were used throughout the results section. Non-parametric statistical tests were applied to the nominal data and, where applicable, the continuity correction for Pearson’s chi-squared test was employed to investigate whether there was a statistically significant association between variables.
For multiple variable questions we used net analysis. This is a technique commonly used in market research to indicate a net result, either positive or negative. One result is deducted from the other, thus enabling a cleaner, different visual presentation to the normal histogram or table.
Ethnicity was based on the 2001 UK Census categories, with minor changes following piloting. To simplify reporting in the analysis we have aggregated the Asian categories, so Asian in this paper refers to the categories British Asian, Indian, Pakistani, Bangladeshi, any other Asian background.
Results
Respondent profile
Most respondents (n=1,156) were female (female 70 per cent, n=809; male 30 per cent, n=347), with similar proportions from years 1 and 4. The main (self-defined) ethnic groups were White 48 per cent and Asian 32 per cent with black or black British making up 8 per cent of the sample.
Accurate data on student characteristics were not available, but comparisons with data from the UCAS applicant pool for the cohorts (2001 for final year and 2003 for first year) indicated that this was a fairly typical representation of pharmacy undergraduate students of the time.2
Desire to study pharmacy
Respondents were asked about the strength of their desire at the time of entering pharmacy school to (a) study pharmacy and (b) be a pharmacist. There was a high level of interest across both first and final years in studying pharmacy (93 per cent, n=611; 88 per cent, n=448) and the idea of being a pharmacist (92 per cent, n=603; 88 per cent, n=446) with no significant difference between the responses of first-year and final-year students in both cases.
No significant difference was seen in the desire of students to study pharmacy or be a pharmacist between male and female respondents. Owing to the profile of the respondents, comparisons between different ethnic groupings were only possible for the White and Asian subgroups. Although most Asian and White students described their desire to study pharmacy when they started their studies as “very strong” or “strong”, 13 per cent (n=49) of Asian students compared with 5 per cent (n=27) of White students selected the response “not very strong” or “not at all strong”. This distribution of responses was significantly different for Asian respondents compared with White respondents (chi-squared, P<0.05).
Commitment to pharmacy as a course
The strong desire to study pharmacy and become a pharmacist is reinforced when we asked how committed they were to pharmacy. Seventy-three per cent (n=478) of first-year respondents and 71 per cent (n=361) of fourth-year respondents stated that pharmacy was their first and only choice when they chose which subject to study at university. There was no marked difference between males (74 per cent, n=255) and females (72 per cent, n=577). However, a smaller proportion of Asian students (69 per cent, n=256) than White students (78 per cent, n=432) made pharmacy their first choice (chi-squared, P<0.005).
Second choice to medicine
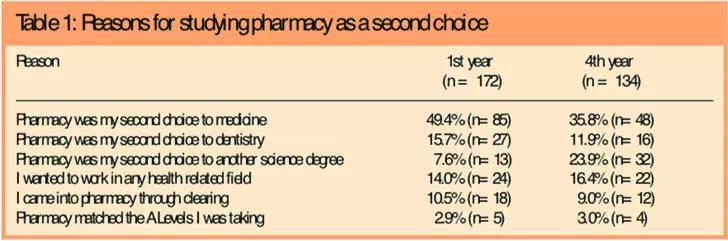
Respondents were asked if pharmacy was their first choice of study and 73 per cent (n=478/658) of first-year students and 71 per cent (n=361/508) of final-year students stated that it was. For many who had chosen another course of study as their first choice (first year, n=172; final year, n=134), pharmacy was second to medicine (first year, n=85, 49 per cent; fourth year, n=48, 36 per cent) (see Table 1).
There was no association between gender and the reason for studying pharmacy as a second choice. However the distribution of responses from Asian (n=112) compared with White students (n=114) was significantly different (chi-squared, P<0.001) since, although medicine was the principal first-choice subject for both Asian and White students, a larger proportion of Asian students (46 per cent [n=52]) than White (31 per cent [n=35]) named medicine as their first choice (Table 2).
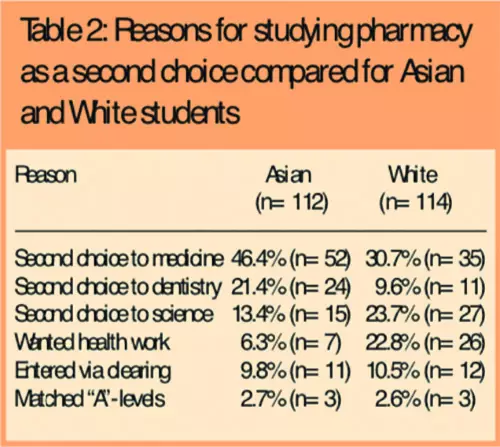
Furthermore, for Asian students, it was more common for pharmacy to have been their second choice to dentistry (21 per cent, n=24) than for White students (10 per cent, n=11). After medicine, White students were more likely to have chosen pharmacy as a second choice to another science degree (24 per cent, n=27) than Asian students (13 per cent, n=15).
Route of entry to the pharmacy course
Applicants to university courses apply via a centrally administered system operated by UCAS (Universities and Colleges Admissions Service9). The options are rated “conditional firm” (CF — the student’s first choice, which is conditional on them achieving certain grades), “conditional insurance” (CI — the student’s reserve choice, again conditional on them achieving certain grades but usually lower graded than the student’s CF choice and chosen in case their achieved grades are lower than expected) or “unconditional firm” (UF — the student’s first choice but one that is not conditional on them achieving certain grades). Those who are not offered a place before publication of “A”-level results enter school through clearing.
Table 3 shows the route of entry to schools of pharmacy. Seventy-one per cent (n=814) of all respondents entered through CF offers and 13 per cent (n=149), through CI offers. Only two students (0.2 per cent) entered through UF offers and 16 per cent (n=187) of the total sample entered through clearing. Using data from the subset of White (n=122) and Asian (n=112) students, although not statistically different, it was seen that for those students who do not choose pharmacy as their first choice, a higher proportion of Asian students (40 per cent, n=45) than White students (23 per cent, n=28) entered through clearing. There was no significant difference between male and female students.

The proportion of Asian and White students who selected “entry via clearing” as a reason for entering pharmacy as a second choice subject was small in absolute terms, about 10 per cent of the total for each subgroup (Asian 10 per cent, n=11; White 11 per cent, n=12). However, when asked in another question about how they entered their course, 16 per cent (n=187) of all respondents (first and final year) entered via clearing. Therefore entry via clearing is not synonymous with second choice of pharmacy as a career. It appears likely that a number of clearing entrants did have pharmacy as first choice but were unable to obtain an offer of a place in the first round.
There was no significant association of route of entry with gender of applicants. However, there was a significant association with ethnicity (chi-squared, P<0.001). Fewer Asian applicants entered as firm choice candidates (63 per cent, n=232) than White students (78 per cent, n=428) and more entered through clearing (22 per cent, n=82) than did White students (11 per cent, n=61).
Choice of school of pharmacy
The relative importance of the influence of a range of aspects of schools of pharmacy on their choice of institution for study is shown in Figure 1, which presents the results as a net analysis. (Results are shown as the difference between the percentage of respondents rating as important and the percentage rating as not important.) The three most important factors for choosing a school of pharmacy for both first- and fourth-year respondents were: reputation of the school of pharmacy; reputation of the university; and the nature of the course as described in the prospectus. The least important aspect when choosing a school of pharmacy for both first- and fourth-year sample respondents was that of having family at the university.
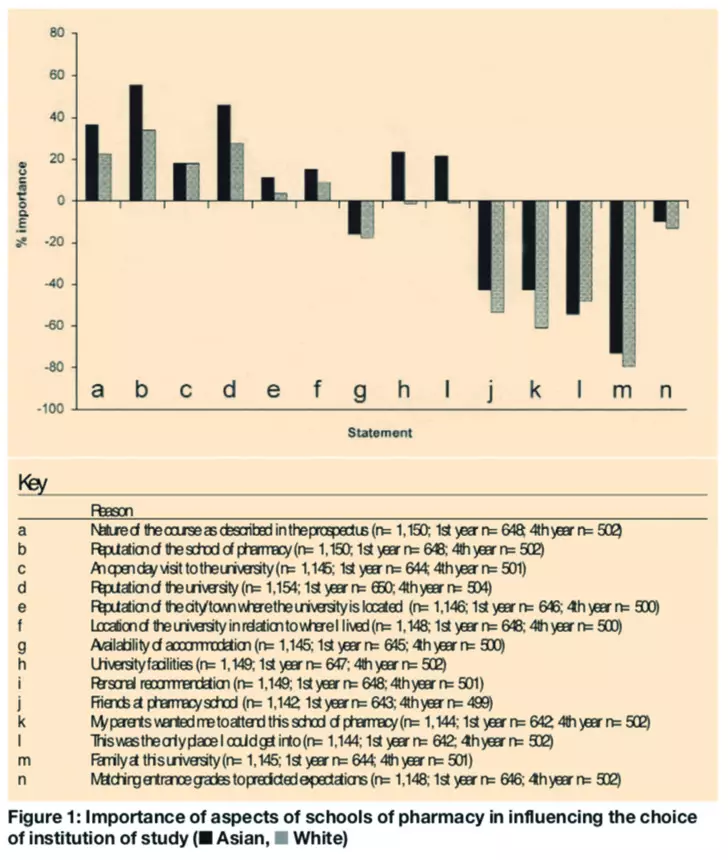
There was a significant association between gender and the responses to five of the options. Females were more influenced by the nature of the course as described in the prospectus (chi-squared, P<0.001), the reputation of the university (chi-squared, P<0.005) and the location of the university in relation to their home (chi-squared, P<0.005). Males were more influenced by friends at the school of pharmacy (chi-squared, P<0.001) and family at the university of study (chi-squared, P<0.001).
There was a significant association between ethnicity (White or Asian origin) and responses to nine of the options. These options fell into two groups — one associated with the university or school of pharmacy and one associated with personal factors. In relation to the former, Asians were more influenced by the reputation of the school of pharmacy (chi-squared, P<0.01) and the university facilities (chi-squared, P<0.001) but less influenced by an open day or visit to the university (chi-squared, P<0.01). They were also more likely to agree that “this was the only place I could get into” (chi-squared, P<0.01).
The personal factors indicating a significant difference in response were: “personal recommendation” (chi-squared, P<0.001);“friends at the school of pharmacy” (chi-squared, P<0.001); “my parents wanted me to attend this school of pharmacy” (chi-squared, P<0.001); and “family at the school of pharmacy” (chi-squared, P<0.001). In all these the distribution of responses showed Asian students to be more influenced than White students.
Discussion
Limitations of the study
The key limitation of this study is the low response rate of 35 per cent. This rate is low for pharmacy practice research, but typical of a one-shot survey.10 Slippage in design and negotiation with schools of pharmacy meant that the timing of administration was too late in the academic year. In most schools students are less likely to be in the university at this time because taught courses have finished.Yet when recording the uneven response rate from schools (14 per cent to 83 per cent) we noted that where students were asked to complete during lecturer contact time, a high response rate was obtained. Clearly this had some influence on students’ motivation to complete, but examination of the responses between schools showed there was no evidence to suggest that the responses were in any way different between the schools. There is a short window of opportunity in higher education institutions for accessing final-year students.
A further factor to take into account was the overload on schools of research and surveys at that time, at least three national-level studies being conducted at the same time and there was some confusion about duplication of effort on career surveys.
We would also draw attention to the potential impact in time lag on memory about motivations between first- and final-year students, which may have an effect on the comparative results.
Commitment
We have shown that most students choosing to study pharmacy have a firm commitment to a career in the profession. About half of first- and final-year students described their desire to study pharmacy and to be a pharmacist as very strong. There was some indication that final-year students were less committed than first-year students to the study of pharmacy or being a pharmacist.
Second choice
It is strongly believed (on an anecdotal basis) that some people who train to be pharmacists really wanted to be doctors. Now there is some evidence to support that notion. Approximately one quarter of this cohort of students entered pharmacy having failed to achieve entry to their first-choice subject, which in most cases was a place in a medical or dental school. The provision of rapid-progress medical school places in the UK for mature students may be an attraction for such students and this, coupled with the expanding clinical role potential of pharmacy in the 21st century, will make it interesting to see what direction this group take later in their career.
Gender
Most respondents were female (70 per cent) yet no significant differences were identified between male and female students to this particular set of questions: on entry route, the desire to study pharmacy or be a pharmacist, this was their first and only choice. By comparison. there was a significant difference in the reasons for choice of school, with females being more influenced by the nature of the course as described in the prospectus, the reputation of the university and the location of the university in relation to their home. Conversely, males were more influenced by friends at the school of pharmacy and family at the university of study. The reasons for these differences are not clear and warrant further investigation.
Ethnicity
This sample allowed comparisons to be made between the two major ethnic groupings: those of White and Asian students. In the group that entered pharmacy as a second choice, there was a clear difference between Asian and White students in relation to their first-choice course. More Asian than White students identified medicine and dentistry as first choices. As with the comment above, it may be that with more medical school places coming on stream, after registration this group might not pursue a career in pharmacy.
The data raise some questions. Are the differences we note due to discrimination at entry level in the schools, or is it an applicant’s lack of knowledge of schools, or even a lack of confidence in success? As with variations in response based on gender, these differences warrant further investigation. In addition, it was noted that there were differences in the gender profile of the two main ethnic groupings which could also have gone some way to account for the differences observed. Further details on the differences between the ethnic groups can be found in the project report.2
Around 20 per cent of pharmacy students entered through clearing and twice the proportion of Asian compared with White students entered via this route. The attrition and progress of this group requires further study.
Conclusion
This study confirms that most applicants to study pharmacy were strongly committed to the subject. In addition, this study has allowed us to put an empirical figure on what was previously known anecdotally, that a small proportion of students who at the time of applying for pharmacy would rather study medicine. We have produced insights into key motivators in school selection and shown there are some differences between ethnic groups, but markedly fewer between male and female applicants on these questions.
About the authors
Jill Jesson, BSc, PhD, is a lecturer at the Aston Business School, Chris A. Langley, PhD, MRPharmS, is a senior lecturer in pharmacy practice at the School of Life and Health Sciences and Keith A. Wilson, PhD, FRPharmS, is professor of pharmacy practice and deputy dean at the School of Life and Health Sciences, all at Aston University
Correspondence to: Dr Jesson at Aston Business School, Aston University, Birmingham B4 7ET (e-mail j.k.jesson@aston.ac.uk)
References
- Willis S, Hassell K. Supply and demand for preregistration placements: don’t believe the hype! Pharmaceutical Journal 2007;279:42.
- Wilson K, Jesson J, Langley C, Clarke L, Hatfield K. Pharmacy undergraduate students: career choices and expectations across a four-year degree programme. Report commissioned by the Pharmacy Practice Research Trust, 2006.
- Booth TG, Harkiss KJ, Linley PA. Factors in the choice of pharmacy as a career. Pharmaceutical Journal 1984;233:420.
- Rees JA. Why male and female students choose to study pharmacy. British Journal of Pharmaceutical Practice 1984;7:90–96.
- Silverthorne J, Price G, Hanning L, Cantrill J. Factors that influence the career choices of pharmacy undergraduates. Pharmacy Education 2003;3:161–7.
- Ferguson J, Roller L, Wertheimer A. Social factors motivating students toward a career in pharmacy: an international study. Journal of Social and Administrative Pharmacy 1986;3:127–35.
- Healthcare Commission. NHS Staff Survey. London: Healthcare Commission, 2004.
- Arnold J, Loan-Clarke J, Coombs C, Park J, Wilkinson A, Preston D. Looking Good? The Attractiveness of the NHS as an Employer. A Report for the Department of Health. Loughborough: Loughborough University, 2003.
- UCAS. www.ucas.ac.uk (accessed 27 April 2009).
- Jesson J, Pocock R. Generating data: survey methods. In: Harding G, Taylor J (editors). Pharmacy Practice. London: Harwood Academic Press, 2001; 432–56.