Key points
- This study sought to determine the response actions after a supply chain disruption occurs, which previous research has largely ignored.
- This wide academic research used a mixed method approach for trust and acute care hospitals in England, Wales and Ireland.
- The patterns of strategic responses to supply chain disruptions varied depending on the length of time since the disruption, and this can impact performance.
- A unique shortage management supply chain road map is proposed to guide practitioners to address the pernicious and growing problem of drug shortages.
Introduction
All supply chains are at risk from disturbances that can negatively affect them[1]
. Therefore, it is crucial that supply chain managers identify these potential disturbances and develop mitigation and contingency plans to increase or improve resilience[2]
. Economic globalisation, rising volatility of markets and trends towards outsourcing and single-sourcing are making supply chains ever more complex[3],[4]
. The causes of supply chain disruptions are disputed, but can be categorised in the healthcare arena as economic, manufacturing and regulatory factors. The consequences can be catastrophic at a patient level — particularly when life-preserving medicines are affected by drug shortages — and the problem is growing year on year[5],[6]
.
It is challenging for an organisation to develop and sustain a competitive advantage in the modern pharmaceutical supply chain, but it can be achieved to the extent that trading partners share a common ‘world view’ of supply chain management[7]
. With multiple agencies involved in the pharmaceutical supply chain, all with conflicting agendas and uncoordinated approaches that are spread across world economies, collaboration is difficult and product demand is significant when compared with the supply, especially with ongoing disruptions[8]
.
Supply chain disruption: academic perspective
Supply chain disruption research has been covered from a variety of perspectives, including risk management[9],[10],[11]
, strategic management[12],[13]
and strategic resilience management[14],[15]
.
Flow of goods, information, financial resources and multiple interfaces have to be integrated, which increases supply chain vulnerability[16]
. Disruptions are often triggered by disturbances on the supply and the demand side (e.g. terrorist attacks, natural disasters, changes in consumer behaviour, technological crises or bankruptcy). Lean supply networks, which are tightly coupled and operate at minimum levels of time and material buffers, are vulnerable to local disturbances. This vulnerability can be a major threat to global or networked supply chains, and may have negative effects on costs, quality, flexibility, image and, ultimately, the valuation of all the participants in the network. Therefore, cross-company supply chain risk management becomes a critical success factor. The consensus emerging in research and practice is that systematic risk management is required to deal with these challenges; however, opinions differ on the necessary elements required. Research about the process of supply chain risk management implementation has received less focus[10]
.
Resilience can be achieved by creating redundancy or increasing flexibility. Redundancy involves keeping some resources in reserve in case of a disruption, such as using multiple suppliers and keeping deliberately low-capacity utilisation rates. It has been argued that significantly more leverage and operational advantages can be achieved by making supply chains flexible and dynamic[17]
. Flexibility requires building in organic capabilities to sense threats and respond to them quickly. Although necessary, redundancy represents pure cost with no return, except in the eventuality of disruption. Many academics have focused on sectors other than healthcare, so conceptual frameworks have not been validated empirically[18]
.
Supply chain disruption: healthcare perspective
The increasing trend by manufacturers to outsource production of medicines to countries such as India and China has had positive cost benefits, which is an important strategic goal for suppliers to improve overall supply chain efficiencies[19],[20]
. However, the elongated supply chains and potential for quality implications has not improved the shortage problem[20]
. This is especially important during sustained periods of volatility in global trade, where organisations are using supply chain management to gain a competitive edge[21]
.
However, owing to the complex nature and structure of the pharmaceutical chain, regulatory measures designed to improve drug supply can actually worsen the situation; supplies of critical drugs may reduce as pharmaceutical companies or resellers divert products to more profitable markets[22]
. Adaptable and agile organisations will survive in the long term[23]
; smart supply chains can create customer or shareholder value through their ability to anticipate and respond to changes in environmental conditions and threats. Transforming the pharmaceutical industry supply chain through sense and response models will become a matter of adapt or perish[24]
. Adaptability invokes the ability of organisations to anticipate and quickly respond to sudden changes in environmental conditions[25],[26]
.
Supply chain disruption: pharmaceutical industry perspective
Product development in the pharmaceutical industry is separated into the discovery, exploratory and development phases, with a development cycle typically lasting around 15 years, although this is complicated by globalisation and the multiple layers of delivery through distributors and wholesalers. Each participant in a drug delivery process has their own motivation and access to information, and is regulated and managed in different ways[8]
. The pharmaceutical supply chain is different to other organisational supply chains owing to the scale of the operation and the volume/variety mix of its products[27],[28]
. A given hospital pharmacy could purchase around 4,000 lines of stock from pharmaceutical wholesalers, and this is only a part of the range held by these operations. This indicates that the range of stock held and the volume of lines processed per day are extremely high in the downstream supply chain.
With the globalisation of the drug manufacturing sector, manufacturers are targeting markets such as China and Brazil as locations not only to sell to, but also for outsourcing manufacturing, research, development and clinical trials. However, an array of issues (e.g. security, intellectual property and knowledge of government legislation) within these emerging markets has presented disruption challenges to drug producers. China is one of the fastest growing markets among the emerging countries[29]
.
The number of new drug shortages has tripled since 2006. This problem has been reported worldwide, gaining prominence in multiple domains and several countries in recent years[5]
. Supply chain breakdown through disruptions not only brings immediate damage to the affected pharmaceutical company, but can also threaten human health and wellbeing by causing medical supply shortages[30]
.
Personalised drugs require more complex manufacturing and distribution processes than shelf-stable medicines. Furthermore, the push for safety in the supply chain is needed for backward visibility to manufacturers’ suppliers and suppliers’ suppliers in a real-time and robust way, so that an integration of information flow is enabled up and down the supply chain. Market warehouses and distribution centres, whether run by third-party logistics companies, or through dedicated or multi-user distributors, are at the centre of the distribution chain; however, these can be missed out in a direct-to-market (disintermediation) model favoured by some larger pharmaceutical companies[31]
.
The growth in emerging markets through global pharmaceutical outsourcing adds another level of complexity. However, global expansion is making it more difficult for pharmaceutical manufacturers to manage their supply chain[22]
. The need for flexibility is great as the industry undergoes changes in product mix, manufacturing routes and distribution channels for different product types[32]
.
Supply chain theory development
Bode et al. presented the first systematic empirical investigation of organisational responses to supply chain disruptions, introducing the concept of supply chain disruption orientation (SCDO)[33]
. This built on earlier organisational orientation works by Daft and Weick that investigated active and passive firms[34]
. They examined why, how and under what conditions firms respond to supply chain disruptions. Bode et al. introduced a model of organisational responses to supply chain disruptions, using dual theoretical lenses: the resource dependency theory[35]
and information processing theory[36],[37]
. In regard to resource dependency theory, Pfeffer and Salancik stated that, although organisations depend on their environment to survive, they seek to assert control over the resources they require to minimise their dependence[38]
. Galbraithe proposed that uncertainty refers to the “difference between the amount of information required to perform a task and the amount of information already possessed by the organisation”[39]
. The more environmental uncertainty a firm faces, the more information it needs to gather and process to achieve a given level of performance.
Aims
The focus of this research is on post-supply chain disruption management; response actions taken after the disruption has occurred, specifically in the secondary care acute hospital sector. This study employs a theory-testing design to test novel constructs to augment the existing academic body of work against the following research question: how do the actions of buffering and bridging in response to supply chain disruption events affect the performance of shortage management?
To answer the research question, three key constructs were developed.
1. Supply chain disruption orientation construct
The first construct considered SCDO, as defined by Bode et al. as: “a firm’s general awareness, consciousness of, concerns about, seriousness towards and recognition of the opportunity to learn from supply chain disruptions”[33]
. This construct builds on Bode et al.’s previous work on understanding responses to supply chain disruptions[33]
.
2. Supply chain disruption performance construct
The second construct considered the performance aspect, which had not been considered in previous research on disruption orientation. The overall supply chain performance is multifaceted and is affected by factors such as service quality and overall operating costs; therefore, trade-offs and compromises are necessary to achieve the best performance[40]
. Taking an information processing perspective is critical to supply chain success[41]
.
3. Organisational response construct
The final construct extends the examination of post-supply chain disruption strategic management by considering dynamic response and its effect on performance. Strategic management and responses do not operate in a vacuum or at a single point in time. Instead, they change and adapt to the environment they operate in[24]
. Organisations can learn from post-disruption decisions and their performance can vary with the response spectrum.
This construct incorporates prior work on organisational responses to adverse environmental events[42]
. Taking an information processing perspective[36]
and resource dependency perspective[38]
, Bode et al. developed the organisational response construct to encompass the repertoire of disruption response[33]
. These include the dual strategies of buffering (the attempt to establish safeguards to protect a firm from disturbances) and bridging (the attempt to manage uncertainty through employing ‘boundary-spanning’ and ‘boundary-shifting’ actions with an exchange partner[43],[44]
), and building on earlier generic response alternatives[44]
.
Methods
Quantitative and qualitative approaches can be used to complement each other in providing methodological triangulation and enhance study reliability[5],[45]
. Therefore, considering the complexity of the research question, a mixed-methods approach was employed (see Figure 1).
Phase I included a quantitative online survey, followed by qualitative focused interviews in phase II. The inductive phase III focus groups allowed the researcher to process understanding as a social phenomenon, which is not undertaken by individuals in isolation from each other.
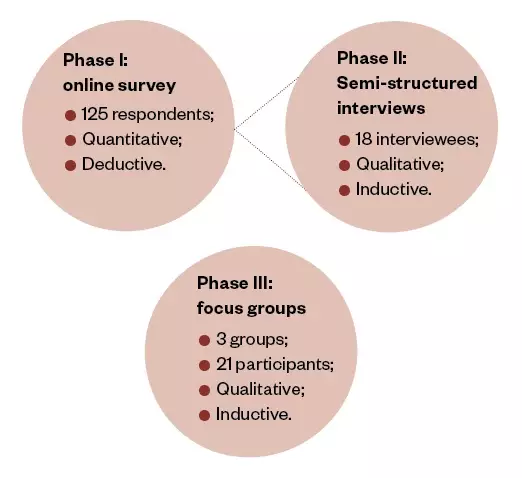
Figure 1: Three-phase, mixed-methods research design
Phase I was an online survey of 125 NHS trusts and acute care hospitals in England, Wales and Ireland. Phase II included 18 semi-structured interviews with the individuals responsible for managing shortages within some of the hospitals from phase I. Phase III included three focus groups: the regional specialist pharmacist managers in England, the regional specialist pharmacist managers in Wales and a senior cohort group from the buyer side of the pharmaceutical acute care secondary supply chain.
Phase I: online survey
Creation of the survey
Using the University College London Hospitals NHS Foundation Trust’s shortage database, a typology was prepared from a list of 2,008 different medicines reported nationally as having a disruption in the pharmaceutical supply chain. Criteria used were:
- Being readily recognised as in shortage over the past seven years;
- The frequency with which the shortage was reported;
- The severity of impact (meaning there was no substitute readily available).
The drugs that were most frequently disrupted were refined in accordance with this typology.
This list was then verified by the steering committee of practitioners (that included a senior regional pharmacist specialist and lead pharmacist from the acute secondary care sector). The steering committee distilled the list, keeping three of the original ten medicines and discarding the rest. They then added two additional new medicines in shortage: ketamine and lorazepam. The final list, which included a range of drug types for different therapeutic treatments, was as follows:
- Lidocaine injection;
- Aciclovir infusion solution and powder;
- Glycopyrronium bromide injection;
- Ketamine injection;
- Lorazepam injection.
Including specific medicines in a specific medical shortage situation improved the design of the survey by strengthening reliability[46]
. By specifying the medicines and requesting month of occurrence, it improved the trustworthiness of the answers and transferability of the research process employed.
To view the final survey in full, please see ‘Supplementary Information’.
Please note that the University College London Hospitals NHS Foundation Trust’s shortage database is no longer being updated, owing to funding constraints. Therefore, the link is now unavailable.
Online survey dispersal
To avoid sampling bias, the target population for the survey was the largest available within the NHS trust and acute care hospitals in England, Wales, Northern Ireland and Ireland (n=318). This included 261 acute care hospitals and trusts in the UK and 57 hospitals in Ireland. Scotland was not included in this research owing to limited resources, and to enable a more focused study within a deliverable timescale.
Validity and reliability
Cronbach’s alpha is one of the most commonly used tests for measuring internal consistency reliability[47]
; this was used in the analysis of this research. Internal consistency reliability was considered as part of the individual scale item analysis. Where internal consistency reliability reflects the degree to which each item is intercorrelated with other items in the pool, it indicates how well the items fit together conceptually[48]
.
The survey design included procedural remedies to prevent common method variance[49]
. A summary of the statistical variables used in the hypothesis testing are shown in the ‘Supplementary Table’. Although the survey included an outline of the general objectives of the study in the participants’ information sheets, no indication was provided as to the specific relationships under investigation.
Measures
Dependent variable: The fill rates for shortage performance immediately after the disruption impact (PERF1; i.e. up to 8 weeks after the disruption) and shortage performance after the impact (PERFPOST1; i.e. 8–16 weeks after the disruption). Both were used as dependent variables in all of the regression analyses presented.
Independent variables: The role of the respondents (e.g. pharmacist specialist).
Independent variables (nominal and ordinal): Bed numbers were used as a control variable in all of the regression analyses presented.
Independent variables (continuous): All descriptive statistics for continuous independent variables were measured on a five-point Likert scale, where a higher score represented a more positive attitude to the statement.
Control variable: The number of staffed beds served (bed numbers) was used as the control variable in the ordinal regression as it is a major demographic used by both global organisations, such as the Organisation for Economic Co-operation and Development[50]
, and local healthcare societies and national governments[51]
. It has also been used in previous shortage impact research in acute care hospitals, for example where more time was spent tracking shortages in hospitals with larger bed numbers, and more money was spent by larger hospitals than smaller bed-number hospitals on obtaining alternative products of the same therapeutic class[52]
.
Other contextual variables: Whether the respondent hospital was in a collaborative hub, federation or neither, and the inpatient medicine budget.
Phase II: interviews
In total, 18 semi-structured interviews (14% of the survey respondents) were conducted with the individuals responsible for managing shortages within the hospitals (usually the lead pharmacist), drawn from all secondary care acute hospitals in the UK (excluding Scotland) and Ireland.
From the analysis of the interviews, a case-by-case variable matrix was used and the outputs placed into a pivot table, ordering each case by value, before being compared and considered in relation to the research’s three constructs.
Phase III: focus groups
Focus groups were conducted for the entire population of regional specialist pharmacist managers in England and Wales (with a separate focus group for each), and a third focus group was conducted with a senior cohort group from the buyer side of the pharmaceutical acute care secondary supply chain. In total, there were 21 participants.
Statistical models
Statistical regression models were built in SPSS® (IBM, UK) to test each of the constructs to include the main dependant variables: PERF1 and PERFPOST1.
From the qualitative analysis of the interviews, the shortage management response actions were summarised against the performance using NVivo (QSR International, Australia).
Results
Online survey respondents
Overall, 39% of hospitals responded to the online survey (n=125/318). There was a very low amount of missing data in the survey responses — 146 data points from a possible 7,875 data points (<2%) — owing to respondents not providing an answer. Respondents’ hospitals were almost evenly split between those who were in collaborative hubs or federations, and those who were not. The patient medication budget for the respondent hospitals varied significantly, and ranged from £10m to £15m.
Quantitative online survey analysis
Ordinal regression was determined to be the most appropriate procedure for all but one of the three constructs. This was because the aim was to look at the effect of several independent variables on a dependent variable which, in all cases except one, was ordinal with four levels (PERF1). For construct number three (organisational response), where the dependent variable was continuous (SCDO average) and the independent variable (hospital numbers) was ordinal, a one-way ANOVA (analysis of variance) was used. However, when the assumptions of this parametric test were not met, a non-parametric alternative (Kruskal-Wallis test) was used instead.
For the continuous independent variables, all the items (apart from ‘vary response internally’ and ‘vary response time’) represent the mean of several items for a particular dimension. Means tended to be average or low (around or just above the mid-point of the scale, 2.5). Means were notably higher for ‘vary response internally’ and ‘vary response time’. The two items with lowest means were ‘BUFPOST average’ (buffering actions) and ‘BRI 1 to 7 average’ (bridging actions). Standard deviations were low for most items, suggesting low dispersion around the mean. The range was quite small on many items, suggesting that responses were not widely dispersed.
There was a considerable range of explanatory power among the models within each dependent variable, but the best models achieved quite impressive levels of Pseudo R2.
For PERF1, the best models were model 4 (43%), model 2 (39.4%) and model 1 (36.6%). The significant independent variable in models 1 and 2 is the SCDO average, and the disruption severity and SCDO average in model 4. These independent variables are good predictors of PERF1. It is worth noting that while model 4 does show some improvement in Pseudo R2 over models 1 and 2, it is not a great amount, and one might conclude that SCDO is a greater predictor of performance than disruption severity.
For PERFPOST1, there is a similar range of Pseudo R2 among the models, with the highest being models 8, 7 and 5, with Pseudo R2 of 48.4%, 44% and 41.4%, respectively. There is a large gap to the next best model, model 6, with 34% Pseudo R2. This suggests that buffering, bridging and feedback are important in predicting PERFPOST1.
Therefore, the best models for predicting PERF1 tend to be poor for predicting PERFPOST1, and vice versa. This suggests that different variables are important in understanding each type of performance.
Qualitative analysis
The descriptive analysis highlights from the online survey are shown in Figure 2.
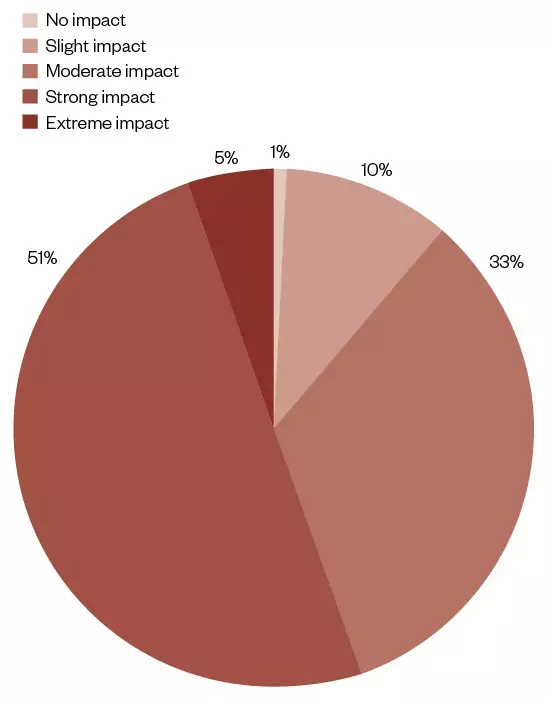
Figure 2: Disruption impact severity causing pharmaceutical shortages in acute care hospitals in England, Wales and Ireland
The hospitals’ responses to an online survey as to the severity of the shortage used a 5-point Likert scale: no impact; slight impact; moderate impact; strong impact; and extreme impact. The responses are summarised and categorised as to the severity of the shortage as a percentage of those responding (n=117).
For the disruption severity, only 5% of respondents said that the impact had been ‘extreme’. However, more than half of the respondents said that the disruption had a ‘strong’ impact (51%), highlighting its importance (see Figure 2).
From the interviews conducted from the survey, more than half of the interviewees (n=12/18; 66.7%) gave really good feedback (see Figure 3). This averaged 8.3 for performance shortage and 8.2 (both out of a possible 10) for performance patient, where patient performance included improved health outcomes and optimal care. A very strong relationship can be seen between good feedback and performance, while poorer performance was seen for limited or no feedback actions.
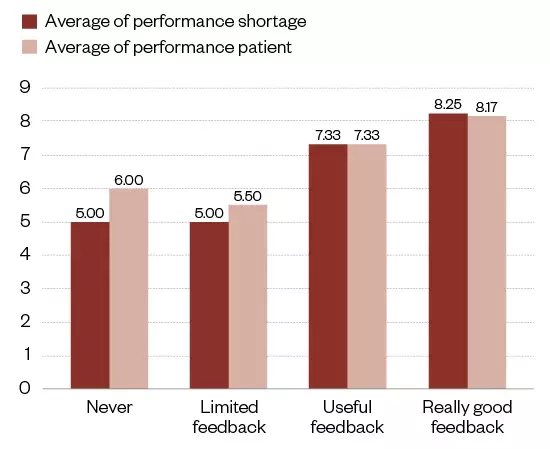
Figure 3: Feedback and medicine shortage performance
The shortages and patient impact from the qualitative analysis of interviews (n=18) summarised against level of feedback.
Figure 4 shows the pharmaceutical shortage performance for PERF1 and PERFPOST1.
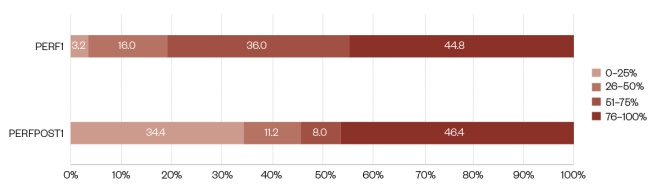
Figure 4: Shortage performance medicine lines fulfilled over the time since the disruption impact
The survey respondents were asked to differentiate between shortage performance up to 8 weeks after the first disruption (PERF1) and 8–16 weeks after the disruption (PERFPOST1). The diagram shows a summary of both variables, in four percentage brackets: 0–25, 26–50, 51–75 and 76–100.
Looking at PERF1, 44.8% of respondents had 76–100% of lines fulfilled immediately, while a further 36.0% of respondents had 51–75% of lines fulfilled immediately (see Figure 4). Whereas, 16.0% of respondents had 26–50% of lines fulfilled immediately and 3.2% of respondents had 0–25% of lines fulfilled immediately.
When comparing PERF1 with PERFPOST1, it is clear the proportion of survey respondents who had 76–100% of lines fulfilled is very similar (44.8% vs. 46.4%), but the proportion who have 0–25% of lines fulfilled had increased (3.2% vs. 34.4%). However, the proportion who had 51–75% of lines fulfilled had decreased (36.0% vs. 8.0%), as had the proportion of respondents with 26–50% of lines fulfilled (16.0% vs. 11.2%).
From the qualitative analysis of the interviews (n=18), the shortage management response actions were summarised against the performance (see Figure 5). This shows the average of the performance score in shortage management in general and also by performance against patient impact. Where both buffering and bridging actions were taken in response to a shortage, the response action was more effective.
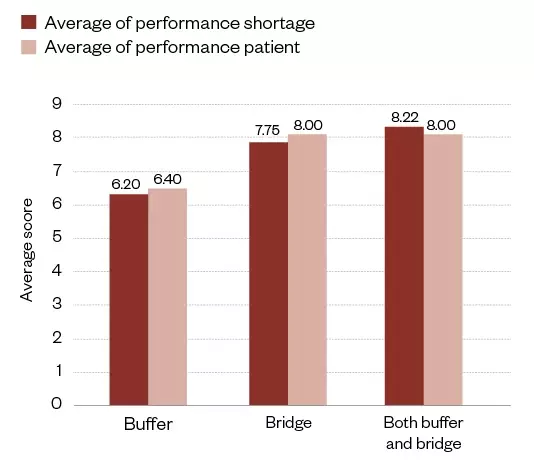
Figure 5: Buffering and bridging response action against shortage performance from the qualitative analysis of the interviews (n=18)
The chart separates the action taken by practice managers in response to shortages (i.e. buffering, bridging or both). The resultant average impact on performance shortage management and performance patient is scored against the y-axis.
Figure 6 shows that the buffering and bridging actions taken in the first eight weeks were different to each other, and that they also changed after the eight-week period. As seen by the shortage performance line, the percentage fill rate at the 76–100% level increased from PERF1 to PERFPOST1, from first impact of the disruption.
In the data outputs of the analysis (see Figure 6), bridging and buffering show a divergence from the initial impact date, with a resultant levelling off on the overall shortage performance. A summary table of descriptive means and shortage management performance can be seen in Table 2.
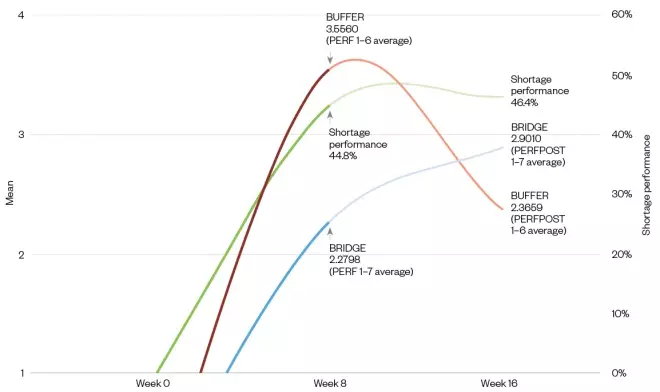
Figure 6: The buffering and bridging dynamic over time since the disruption, including shortage performance
The chart shows the weeks since the disruption, where Week 0 is the impact start. The green line shows the overall shortage performance of medicine lines filled in PERF1 (up to 8 weeks after the first disruption) and lines filled post disruption PERFPOST1 (8–16 weeks after the disruption), where the darker portion is PERF1 and the lighter portion is PERFPOST1. The red line shows the buffering action response for both PERF1 and PERFPOST1, where PERF1 is darker and PERFPOST1 is lighter. The blue line shows the bridging action response for both PERF1 and PERFPOST1, where PERF1 is darker and PERFPOST1 is lighter.
| BUF1 to BUF6 average (week 8) | BUFPOST1 to BUFPOST6 average (week 16) | BRI1 to BRI7 average (week 8) | BRIPOST1 to BRIPOST7 average (week 16) | Shortage performance x10 (week 8) | Shortage performance x10 (week 16) | |
|---|---|---|---|---|---|---|
| Mean | 3.56 | 2.37 | 2.28 | 2.90 | 4.48 | 4.64 |
| Percentage of medicine lines fulfulled | PERFIMM | PERFPOST | ||||
| PERF | 76–100% | 44.8 | 46.4 | |||
BUF: buffering action response average; BRI: bridging action response average; PERFIMM: shortage management | ||||||
Discussion
Post-performance changes over time, as do actions taken in an ongoing ‘fluid’ interaction; therefore, shortage performance strategy cannot stop at the time of disruption impact, or be overreliant on pre-impact risk matrix supply chain planning. This is an important finding as response strategies in post-disruption events demonstrated their dynamic versus static nature when developing theoretical frameworks to understand both supply chain resilience and the precursors of response actions. It also demonstrates whether the motivation is to act for stability or interpretative postures, and that appropriate underpinning academic theories in line with this dynamic nature must be adopted.
Implications for theory
The research question asked how the response actions affected shortage performance. Firms with higher SCDO select and execute buffering and bridging actions effectively and, therefore, have superior shortage performance. This supports Bode and Wagner’s findings[33]
and confirms previous work in risk management[53]
. From information processing theory, organisations may be more active in using information to perform more efficiently in uncertain environments[39]
. Firms with a high SCDO are more likely to have an active approach[34]
and are more likely to respond quickly. Chadist proposed four constructs in the relationship between response time and factors underlying response: preparation, organisational development, partnerships and appropriate reserves[54]
. However, the theory that greater response speed can reduce the impact of disruption is a broad statement. Our research went deeper into the response alternatives into immediate- and post-response actions and their relative immediate- and post-performances on shortage management in the dynamic post-disruption environment, finding different actions were taken throughout the post-disruption time gap and different performances were the output.
Managerial implications
This research contributes to practice by giving practice managers an insight into how SCDO of frontline teams can influence the positive outcomes when managing shortages. This is vital for practice, as noted by a recent European shortages survey: when a medicine cannot be delivered at the instant of patient demand, each stakeholder in the healthcare system is affected[6]
.
The use of feedback and the action–performance dynamic in an operational setting is a constructive approach, as is a better understanding and awareness of the interplay of mitigation strategies against actual outcomes in shortage reduction. Insights and understanding of varying mitigation strategies over time since the disruption, either in combination or as separate tactical interventions in different post-disruption time continuums, is an effective shortage management strategy.
Individual managers do not work in isolation or in a vacuum; their access to information and knowledge is bounded by their reality. Therefore, understanding this when constructing effective skill set matrixes for role templates can improve shortage performance management and overall resource policy.
Figure 7 illustrates the process of how to improve shortage management performance at the operational level to practice stakeholders and managers, as well showing the positive elements of the research findings.
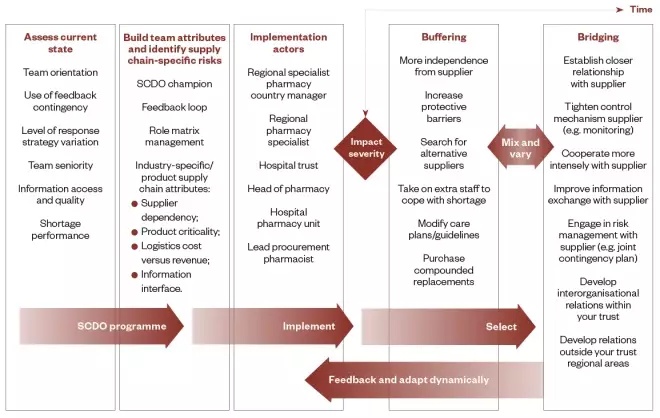
Figure 7: Supply chain disruption shortage management roadmap for practice managers
The first three columns highlight the supply chain distribution orientation programme steps: assessing, building and implementation. The last two columns show the response action options needed to be selected, according to severity, over time since the impact. The governance and delivery management required are shown in arrows.
When attempting to improve shortage performance after a disruption has occurred, managers can be not only better prepared to deal with it by fostering stronger SCDO, but be more effective in performance terms. Management road mapping is a pattern for modelling organisational capabilities with good practices developed by Monomakhoff & Blanc[55]
. It is used for transferring good practices and assessing organisational capabilities both locally and globally[56]
. In distributed organisations it is important to codify local innovations and transfer this knowledge to increase the organisational capabilities of each entity. However, the organisation must also check if these practices are understood and correctly used by operational subsidiaries.
The roadmap, as described by Szulanski & Jensen, follows the five-step principles of organisational adaption, where the different transformation stages are described from a local innovation into a conceptualised organisational practice and then into a transferred organisation capability[57]
.
In the supply chain roadmap (see Figure 7), the steps that underlie the formation of the roadmap’s stages are:
- Step 1 — acquisition: an organisational need is identified and knowledge is found locally (by expert or operational workers) to address this requirement;
- Step 2 — adaptation: knowledge is modified and combined to become organisational knowledge and to be adapted to future learners;
- Step 3 — application: this adapted knowledge is communicated and transferred to the learners;
- Step 4 — acceptation: management around the applied knowledge must be done so that knowledge is effectively acquired by learners and becomes an organisational capability;
- Step 5 — appropriation: the organisation uses the transferred knowledge and skills efficiently.
The first stage describes how there should be an assessment of the information access and quality — for example, ask whether there is an agreed shortage metric. If not, it should be defined using an agreed common typology. As noted by Wowak et al., the lynchpin for traceability centres on boundary-spanning solutions and coping mechanisms that stem from information processing, and knowledge that crosses functional, ï¬rm and geographic boundaries while considering both supply chain and technology elements[58]
. In addition, management should assess the feedback contingency: is the performance outcome of each shortage recorded and feedback given? If not, it should be captured weekly so that it can be readily available in summary feedback to practitioners.
Currently many proactive units in hospitals record and capture shortages in a weekly report. This includes:
- The date the shortage was added;
- The name of the drug;
- The strength and pack size;
- The form of preparation;
- The brand and manufacturer;
- The expected date of return to stock.
The report also contains a list of discontinued lines for cross reference. At present, however, these reports provide only a running commentary and are not linked to any formal performance and feedback capture. This is an important point in deciding which of the elements needs to be emphasised and included in the programme.
The second stage requires an understanding of the industry and product(s) to be included in the programme; it is a generic step, irrespective of the industry. The application principle is represented in the last three stages in the roadmap.
The third stage describes who will implement the programme (the ‘implementation actors’ listed in Figure 7), but these people could be replaced with other roles depending on the country in which the roadmap is being implemented. These are the roles who will apply the high supply chain orientation and dynamic variation in responses.
The last two stages of the roadmap show the two response-mitigating strategies, which can be combined and varied during the time from the impact. The response strategies will depend on the severity of the impact of the shortage, which will be visible through the ongoing capture of the ‘out-of-stock’ weekly reports.
The final element is the flowback of performance. This enables the implementation actors to interpret the action behaviour in performance terms, so that the response mix (i.e. buffer or bridge or both) can be perfected through the time from impact, mediated by the severity of the impact. This last stage represents the principles of acceptance and appropriation, where the improved performance enhances acceptance and the capabilities are recognised and transferred successfully to the organisational unit. By using this roadmapping approach, the internal resources can be optimally exploited to create significant assets for the organisation in a continual lifecycle of capability[59],[60]
.
Limitations and further research
Although all efforts were made to avoid sampling bias, acute hospitals and trusts in Scotland were not included in this research owing to limited resources and to enable a more focused study within a deliverable timescale.
This study focused on the downstream part of the pharmaceutical supply chain (i.e. secondary care acute hospital sector). However, since the pharmaceutical supply chain is a global operation, there are opportunities to improve management throughout the end-to-end supplier chain, including government departments at regional, country and international levels[29]
. Future research could look to extend the scope of this study by including suppliers and distributors in an end-to-end supply chain research investigation, as recommended by Wright[11]
.
The financial impact of shortages and the cost of redundancies as a mitigating response action are not within the scope of this research. Future research could test the buffering and bridging interplay performance outcomes in shortages in different geographies (e.g. in private vs. public health or other public-sector provision), including direct and indirect cost implications.
Conclusion
This study identified that 55.2% of responding acute hospitals based in England, Wales and Ireland did not have 76–100% of medicine lines (for a pre-selected list of medicines: lidocaine injection; aciclovir infusion solution and powder; glycopyrronium bromide injection; ketamine injection; lorazepam injection) fulfilled within eight weeks of a disruption to a supply chain.
The research examined post-supply chain disruptions, extending the theoretical framework of Bode et al.
[33]
, augmenting the need to balance the larger body of work on prior supply chain disruption decisions and risk management. By identifying new factors that moderate or mediate important relationships within the existing theoretical framework, the concept of SCDO is extended, and new causal relationships are identified through the expansion of thesis constructs: SCDO; supply chain disruption performance and organisational response.
Furthermore, original insights were examined in disruption severity and feedback contingency, as well as the varying of response action empirically tested performance consequences. A new supply chain roadmap was proposed that could provide potential improvements to address SCDO.
Authorship correction
The affiliation details listed for the corresponding author, Paul Morris, were updated on 19 June 2020, as Paul was an alumni of Aston University when the article was published. Edward Sweeney, professor of logistics and systems at School of Engineering & Applied Science, Aston University, has also been added as a co-author in recognition of the fulfilment of the criteria for authorship, and contributions to the conception and design of the work, its acquisition, analysis and interpretation. No further competing interests are declared.
Financial and conflicts of interest disclosure
The authors have no relevant affiliations or financial involvement with any organisation or entity with a financial interest in or financial conflict with the subject matter or materials discussed in this manuscript. No writing assistance was used in the production of this manuscript.
Acknowledgement
PM would like to thank Jack Carnell, Edward Sweeney, Louise Knight and Aristides Matopoulos and Kevan Wind for their guidance and Mark Francis and Nuala Doyle for their senior support and interest in the research.
References
[1] Craighead WC, Blackhurst J, Rungtusanatham MJ & Handfield RB. The severity of supply chain disruptions: design characteristics and mitigation capabilities. Decision Science 2007;38(1):131–156. doi: 10.1111/j.1540-5915.2007.00151.x
[2] Barroso AP, Machado VH & Cruz Machado V. Supply Chain Resilience Using the Mapping Approach. Portugal: InTech; 2011
[3] Harland C, Brenchley R & Walker H. Risk in supply networks. Journal of Purchasing and Supply Management 2003;9(2):51–62. doi: 10.1016/S1478-4092(03)00004-9
[4] Crone M. Are global supply chains too risky? A practitioner’s perspective. Supply Chain Management Review 2006;10(4):28–35
[5] Bogaert P, Bochenek T, Prokop A & Pilc A. A qualitative approach to a better understanding of the problems underlying drug shortages, as viewed from Belgian, French and the European Union’s Perspectives. PloS One 2015;10(5):e0125691. doi: 10.1371/journal.pone.0125691
[6] Pauwels K, Simoens S, Casteels M & Huys I. Insights into European drug shortages: a survey of hospital pharmacists. PloS One 2015;10(3):e0119322. doi: 10.1371/journal.pone.0119322
[7] Spekman RE, Kamauff JW & Myhr N. An empirical investigation into supply chain management. International Journal of Physical Distribution & Logistics Management 1998;28(8):630–650
[8] Breen L. A preliminary examination of risk in the pharmaceutical supply chain (PSC) in the National Health Service (NHS) (UK). Journal of Service Science and Management 2008;1:193–199. doi: 10.4236/jssm.2008.12020
[9] Vlachos D, Lakovou E, Papapanagiotou K & Partsch D. Building robust supply chains by reducing vulnerability and improving resilience. International Journal of Agile Systems and Management 2012;5(1):59–81
[10] Pfohl H, Köhler H & Thomas D. State of the art in supply chain risk management research: empirical and conceptual findings and a roadmap for the implementation in practice. Logistics Research 2010;2(1):33–44. doi: 10.1007/s12159-010-0023-8
[11] Wright J. Taking a broader view of supply chain resilience. Supply Chain Management Review 2013;17(2):26–31
[12] Tang CS. Robust strategies for mitigating supply chain disruptions. International Journal of Logistics Research and Application s 2006;9(1):33–55. doi: 10.1080/13675560500405584
[13] Sheffi Y & Rice JB Jr. A supply chain view of the resilient enterprise. 2005. Available at: https://sloanreview.mit.edu/article/a-supply-chain-view-of-the-resilient-enterprise/ (accessed February 2019)
[14] Teoh SY & Seif Zadeh H. Strategic resilience management model: complex enterprise systems upgrade implementation. 2013. Available at: https://aisel.aisnet.org/pacis2013/242/ (accessed February 2019)
[15] Jüttner U & Maklan S. Supply chain resilience in the global financial crisis: an empirical study. Supply Chain Management 2011;16(4):246–259. doi: 10.1108/13598541111139062
[16] Peck H. Reconciling supply chain vulnerability, risk and supply chain management. International Journal of Logistics Research and Applictions 2007;9(2):127–142. doi: 10.1080/13675560600673578
[17] Lin G & Luby R. Transforming the Military Through Sense and Respond. NY: IBM Business Consulting Services; 2005
[18] Ho W, Zheng T, Yildiz H & Talluri S. Supply chain risk management: a literature review. International Journal of Production Research 2015;53(16):5031–5069. doi: 10.1080/00207543.2015.1030467
[19] Manuj I & Mentzer JT. Global supply chain risk management strategies. International Journal of Physical Distribution & Logistics Management 2008;38(3):192–223. doi: 10.1108/09600030810866986
[20] Whewell R. Supply Chain in the Pharmaceutical Industry: Strategic influences and supply chain responses. Abingdon: Routledge; 2009
[21] Christopher M & Holweg M. “Supply Chain 2.0”: managing supply chains in the era of turbulence. International Journal of Physical Distribution & Logistics Management 2011;41(1):63–82. doi: 10.1108/09600031111101439
[22] Savage CJ, Roberts KJ & Wang XZ. A holistic analysis of pharmaceutical manufacturing and distribution: Are conventional supply chain techniques appropriate? Pharmaceutical Engineering 2006;26(4):1–12
[23] Beth S, Burt DN, Copacino W et al. Supply chain challenges: Building relationships. Harv Bus Rev 2003;81(7):64–73. PMID: 12858712
[24] Ivanov D & Sokolov B. Control and system-theoretic identification of the supply chain dynamics domain for planning, analysis and adaptation of performance under uncertainty. European Journal of Operational Research 2013;224(2):313–323. doi: 10.1016/j.ejor.2012.08.021
[25] Haeckel SH. Adaptive Enterprise: Creating and leading sense-and-respond organizations. Massachusetts: Harvard Business Press; 1999
[26] Heinrich C & Betts B. Adapt or Die: Transforming your supply chain into an adaptive business network. New Jersey: John Wiley & Sons; 2003
[27] Slack N, Chambers S, Brandon-Jones A & Johnson R. Operations Management. 8th edn. Pearson: London; 2016
[28] Ritchie E. Re-engineering the pharmaceutical supply chain in hospital pharmacy: An assessment of practice in the National Health Service. PhD thesis. Manchester; 2002
[29] Ni J, Zhao J, Ung C et al. Obstacles and opportunities in Chinese pharmaceutical innovation. Global Health 2017;13(1):21. doi: 10.1186/s12992-017-0244-6
[30] PricewaterhouseCoopers. Supply chain risk assessment. 2009. Available at: https://www.pwc.com/gx/en/pharma-life-sciences/pdf/supply-chain-risk-assessment.pdf (accessed February 2019)
[31] Nichol P. Disintermediation and intermediation beyond theory. 2016. Available at: https://www.cio.com/article/3058882/innovation/disintermediation-and-intermediation-beyond-theory.html (accessed February 2019)
[32] Transport Intelligence. Global Pharmaceutical Logistics 2012. Bath: Transport Intelligence; 2011
[33] Bode C, Wagner SM, Petersen KJ & Ellram LM. Understanding responses to supply chain disruptions: insights from information processing and resource dependence perspectives. The Academy of Management Journal 2011;54(4):833–856
[34] Daft RL & Weick KE. Toward a model of organizations as interpretation systems. The Academy of Management Review 1984;9(2):284–295
[35] Carroll GR. A sociological view on why firms differ. Strategic Management Journal 1993;14:237–249
[36] Galbraithe JR. Organization Design. Massachusetts: Addison-Wesley; 1977
[37] Tushman ML & Nadler DA. Information processing as an integrating concept in organizational design. Academy of Management Review 1978;3(3):613–624
[38] Pfeffer J & Salancik GR. The External Control of Organizations: A resource dependence perspective. New Ed edn. California: Stanford Business Books; 2003
[39] Galbraithe JR. Designing Complex Organizations. Massachusettes: Addison-Wesley; 1973
[40] Chopra S & Sodhi MS. Managing risk to avoid supply-chain breakdown. Available at: https://sloanreview.mit.edu/article/managing-risk-to-avoid-supplychain-breakdown/ (accessed February 2019)
[41] Bowersox DJ, Closs DJ & Stank TP. 21st Century Logistics: Making supply chain integration a reality. Illinois: Council of Logistics Management; 1999
[42] Mendes Primo MA, Dooley K & Rungtusanatham MJ. Manufacturing firm reaction to supplier failure and recovery. International Journal of Operations & Production Management 2007;27(3):323–341. doi: 10.1108/01443570710725572
[43] Fennell ML & Alexander JA. Organizational Boundary Spanning in Institutionalized Environments. The Academy of Management Journal 1987;30(3):456–476
[44] Meznar MB & Nigh D. Buffer or bridge? Environmental and organizational determinants of public affairs activities in American firms. Academy of Management Journal 1995;38(4):975–996
[45] Easterby-Smith M, Thorpe R & Jackson P. Management Research. 4th edn. London: Sage Publications; 2011
[46] Doty DH & Glick WH. Common methods bias: does common methods variance really bias results? Organizational Research Methods 1998;1(4):374–406. doi: 10.1177/109442819814002
[47] Bryman A & Cramer D. Quantitative data analysis with SPSS release 8 for Windows: A guide for social scientists. Abingdon: Routledge; 1999
[48] Parsian N & Dunning T. Developing and validating a questionnaire to measure spirituality: A psychometric process. Global Journal of Health Science 2009;1(1). doi: 10.5539/gjhs.v1n1p2
[49] Podsakoff PM, MacKenzie SB, Lee JY & Podsakoff NP. Common method biases in behavioral research: A critical review of the literature and recommended remedies. J Appl Psychol 2003;88(5):879–903. doi: 10.1037/0021-9010.88.5.879
[50] Boscheck R. Health care reform and the restructuring of the pharmaceutical industry. Long Range Planning 1996;29(5):629–642. doi: 10.1016/0024-6301(96)00057-X
[51] Siska MH & Tribble DA. Opportunities and challenges related to technology in supporting optimal pharmacy practice models in hospitals and health systems. Am J Health Syst Pharm 2011;68(12):1116–1126. doi: 10.2146/ajhp110059
[52] Baumer AM, Clark AM, Witmer DR et al. National survey of the impact of drug shortages in acute care hospitals. Am J Health Syst Pharm 2004;61(19):2015–2022. PMID: 15509124
[53] Autry CW & Bobbitt LM. Supply chain security orientation: Conceptual development and a proposed framework. The International Journal of Logistics Management 2008;19(1):42–64
[54] Chadist P. Factors underlying companies response to supply chain disruption: A grounded theory approach. Draft PhD thesis. London; 2012
[55] Monomakhoff N & Blanc F. The five-step method to effectively deploy a strategy. [La Méthode 5 Steps: Pour déployer efficacement une stratégie]. Paris: AFNOR; 2008
[56] Rauffet P, Da Cunha C & Bernard A. Managing resource learning in distributed organisations with the organisational capability approach. International Journal of Technology Management 2016;70(4). doi: 10.1504/IJTM.2016.075902
[57] Szulanski G & Jensen RJ. Presumptive adaptation and the effectiveness of knowledge transfer. Strategic Management Journal 2006;27(10):937–957. doi: 10.1002/smj.551
[58] Wowak K, Craighead CW & Ketchen DJ Jr. Tracing bad products in supply chains: The roles of temporality, supply chain permeation, and product information ambiguity. Journal of Business Logistics 2016;37(2):132–151. doi: 10.1111/jbl.12125
[59] Helfat CE & Peteraf MA. The dynamic resource-based view: Capability lifecycles. Strategic Management Journal 2003;24(10):997–1010. doi: 10.1002/smj.332
[60] Pettit TJ, Croxton K & Fiksel J. Ensuring supply chain resilience: development of a conceptual framework. Journal of Business Logistics 2013;31(1):46–76. doi: 10.1111/jbl.12009